

Go Back
The Warm Intro Problem: Building an Investor Network Graph
Table of Content
The Warm Intro Problem: Building an Investor Network Graph
A partner asks it in a Monday meeting. Do we know anyone at this company?
Someone says they'll check. What follows is a Slack message to two colleagues, a LinkedIn search, three passes through an inbox, and a vague memory that someone met their VP of Engineering at a conference. Forty minutes later the answer comes back as "I think Chris might know somebody there."
Every one of those people is already in the CRM. The firm has years of email, calendar and meeting history sitting in a database. It just can't answer the question.
This is where a relationship graph comes in. It's what lets you ask that question, and a lot of others like it, and get back an answer you can trust.
What a Relationship Graph Actually Is
A relationship graph is a map of who your firm knows and how well. It is built from the interactions the firm already recorded, and the connections themselves are the data.
Two things: nodes and edges.
Nodes are entities. People, companies, funds, deals. And interactions (e.g. meetings, emails).
Edges are the relationships between them. Works at. Worked at. Participated in. Introduced by. Each edge carries a weight: how strong that relationship is, inferred from how often two people interact, how recently, in what setting, and in which direction.
Ask for a path into a target company, and the graph walks outward from your team, ranks the routes it finds, and returns the warmest one along with the person to ask.
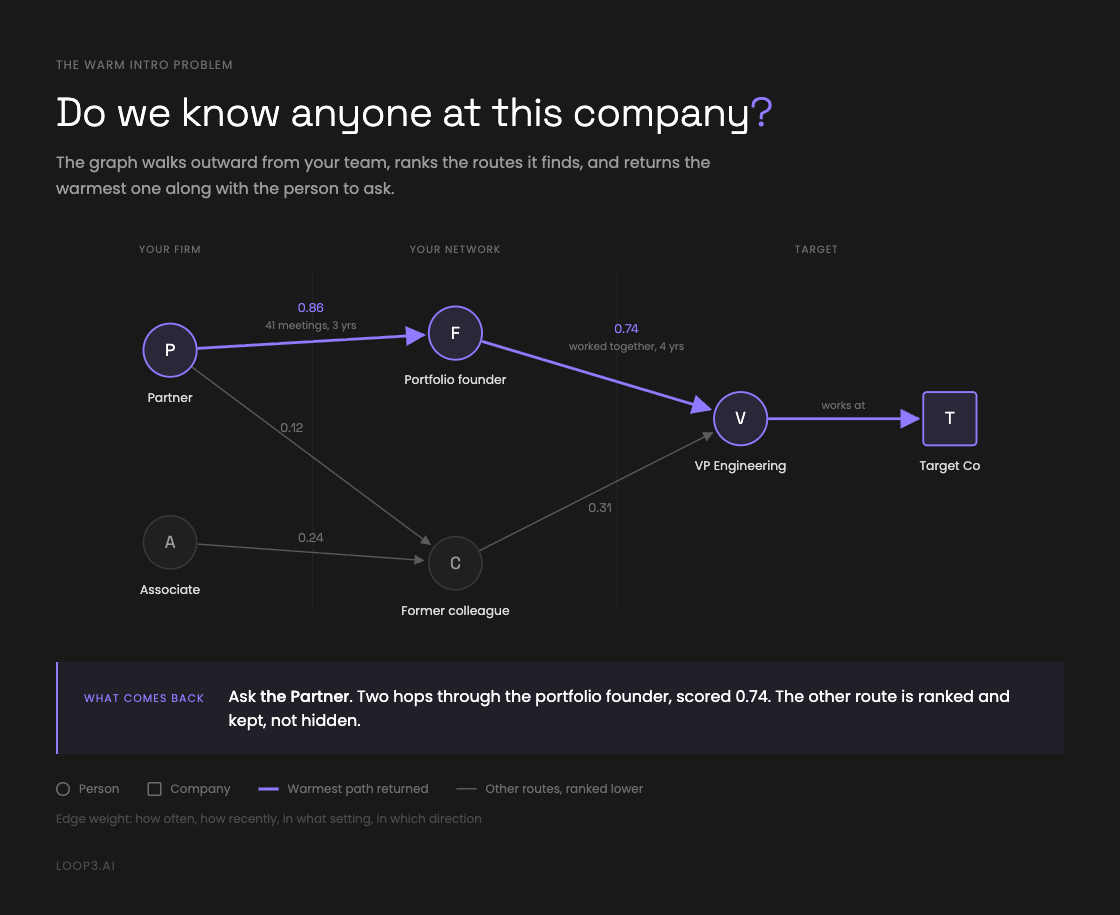
There's no one size fits all to the graph database. The important part is deciding which nodes and relationships you're going to have, and how you map your data onto them.
The database is the last decision, and it is almost never the one that determines whether this works.
The 4 Key Questions It Answers
Affinity's 2026 benchmark report, built on platform data from close to 3,000 firms, has two numbers worth putting side by side. Monthly email volume is the most uniform measure in the set, about a 2x spread between the bottom and top quartiles. The share of tracked relationships that turns into an introduction is the widest, roughly threefold across those same quartiles. Same effort, very different mileage. The difference is knowing who to ask.
- Who can introduce us to this company? Given a target, which people at the firm have the shortest, warmest path in, and through whom.
- Who sources best? Rank the team by companies introduced and by how many of those became real opportunities. Sourcing performance stops being a matter of opinion.
- Which relationships are going cold? Contacts the firm was genuinely close to and hasn't spoken with in months.
- Where is the bus factor? Every deal where exactly one person on the team has ever spoken to anyone at that company. If one person holds a relationship, what happens to it when they take a month off, or leave? The same benchmark puts about 29% of a firm's strong relationships on its single most connected person, and about 65% on the top three. That is measured on the relationships the CRM saw, which if anything understates it. This reframes the network from an asset the firm owns into a set of dependencies on individual people, which is closer to the truth and invisible from a CRM list view.
Here are other sample questions you can get answered with a network graph:
Getting in
- Who is two introductions away from this founder, and through whom
- Who introduced us to this company in the first place
- Who currently works at a target company, and which of them we have ever spoken to
- Which of our portfolio founders, LPs or advisors have a path into this account
- Who in our network matches the customer profile a portfolio company is selling into, and who can make that introduction
Knowing the network
- Who in our network moved from big tech into health tech in the last two years
- Who in our AI network is based in a given city
- Who overlapped with this person at that company, and for how long
- Who has spoken with this person in the last six months, in a meeting rather than a CC'd thread
Running the firm
- Who are our top introducers, ranked by companies that reached a real conversation
- Which relationships does the firm depend on a single person for
- Which strong relationships have gone quiet this quarter
- Which connectors and channels produce the deals that actually convert
Why a Data Warehouse Makes This More Powerful
A data warehouse is the one place where every system a firm uses lands and gets cleaned up: CRM, email, calendar, fund admin, spreadsheets. One record per person and per company, whatever tool it came from. We made the case for the warehouse itself separately, in Data Warehouse for VC 101. You can build a graph without one. It's much better with one, for two reasons: coverage and resolution.
Coverage. A graph built straight off one CRM knows what that CRM knows. A graph built off a warehouse inherits every source already landing there: the second CRM from a merger, the calendars, the LP contacts, the meeting history. Each new source added upstream becomes new edges downstream, without touching the graph.
Resolution. The graph needs exactly one node per real-world person and company, and that deduplication is work the warehouse already did. Without it you get two nodes for the same partner, each holding half of their relationships, and paths that quietly disappear.
The graph doesn't duplicate any of that. It exists for the one job the warehouse can't do: traversal, following the connections outward from one person until you reach the target. And that is something relational databases are structurally bad at.
A relational database stores facts in rows. It has no native concept of a path. To answer who can introduce us to this founder, you have to join people against interactions against people again, an unknown number of times, because you don't know in advance whether the path is one hop or five. You can write that query. You will not enjoy maintaining it.
A graph stores the relationship itself as a first-class object. Traversal is the native operation. What you're buying is the ability to ask how two things are connected and get an answer in seconds. You already have the storage.
Which produces the rule we now apply everywhere: the graph is connectivity, the warehouse is content. Node properties are identifiers and minimal lookup fields. No email bodies, no note text, no interaction subjects. Those stay in the warehouse, behind the access controls they already have. The graph stays small and fast, and permissions stay in one place instead of being reimplemented, badly, in a second system.
That last point solves less than it sounds like it does. Keeping content out of the graph means you maintain one access model rather than two. It does not mean the access model is easy. Deciding which meeting transcripts a given person should be able to search is hard when the only metadata you have is a meeting title. What has held up for us is to stop trying to infer it and ask the firm for a convention instead. A tag, a naming rule, something deterministic. Inference is how you end up with an associate reading a partner's performance review.
Network Graph vs. CRM's Relationship Strength
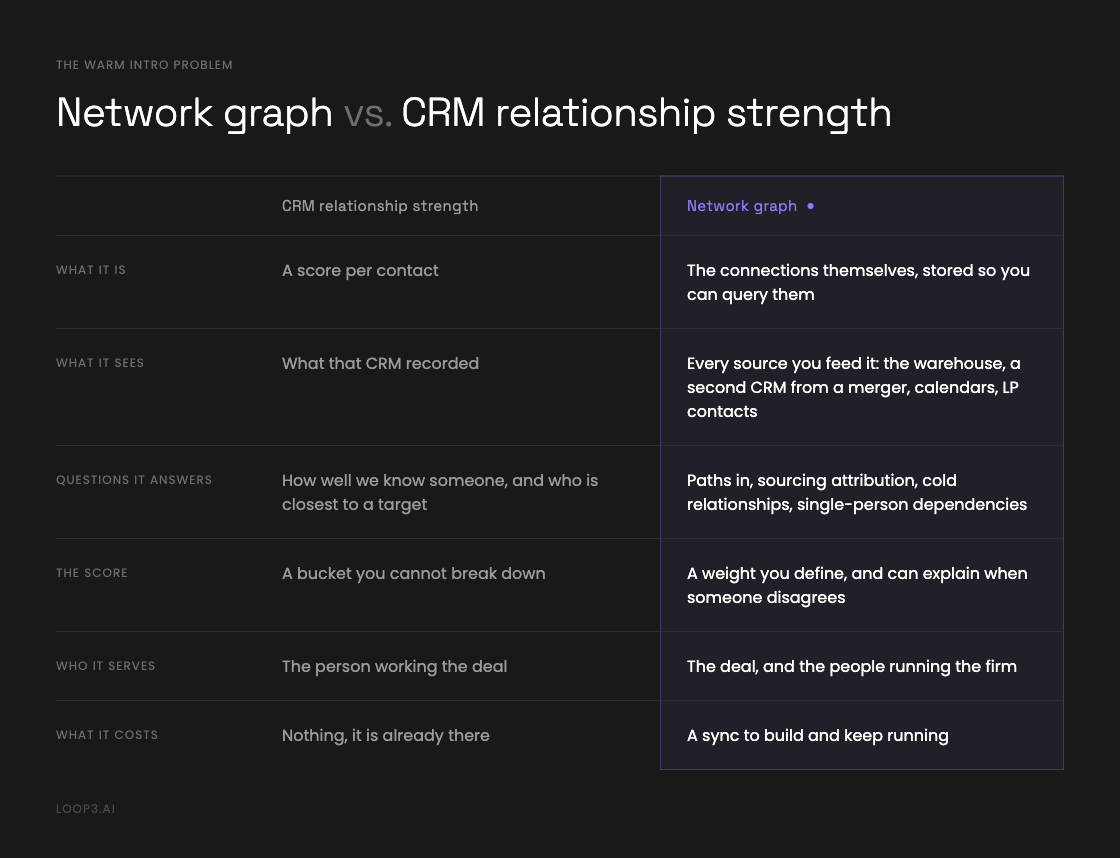
Most relationship CRMs now score how well your firm knows a contact, and some will trace a path into a target company. All of it runs inside the CRM, with no second login and no sync to maintain.
If your network lives entirely inside one CRM, and the only question you have is who gets us in, use it. Do not build this.
The difference is what each one is. A CRM score is a number per contact, calculated from what that CRM recorded. A graph is the connections themselves, stored so you can query them however you need.
The Stack
The source. Whatever already holds resolved entities. Usually a warehouse, Snowflake or BigQuery, with dbt models producing the tables the graph reads from. Without one, CRM entities in Postgres will get you started. It is not the ideal setup: you inherit whatever that single system happens to know, and the entity resolution becomes your problem, handled inside the sync where it is harder to see and harder to fix later. But it is enough to get a first version answering real questions.
The sync. A small service that reads those tables and writes nodes and edges using idempotent merges, so re-running it is always safe. Two modes: a full rebuild, and a delta against a watermark. Plus a deletion pass: CRMs soft-delete the contacts that get merged away, and a delta that only looks for new and changed records leaves them in the graph forever, showing up in path results as people who no longer exist.
The orchestrator. The real fork. Scheduled is simpler: the refresh becomes one more job in a pipeline you already run, and the cost is a window where relationship queries return yesterday's answer. Event-driven closes that window and costs more: CRM changes hit a webhook, land in a queue, and a worker applies them, which means a dead-letter queue, retries and real alerting. We run both. The question is whether a day-old answer about who knows whom would change a decision at that firm.
The graph. A managed graph database. We use Neo4j. It's the least interesting decision in the list, and consistently the one teams spend the most time on before starting.
The interface. Cypher for whoever writes it. For everyone else, an MCP server on top, so questions get asked in plain English and nobody has to learn a query language. Write access stays off for most users. We distribute it as a plugin rather than a bare server, so the MCP and the skills that make it usable install together.
None of this has to start big. The last graph we stood up began as a container on an engineer's laptop, moved to a free tier to prove the sync worked end to end, and only then got a production instance. Most of it runs on infrastructure a firm already has, which is why the first working version arrives in weeks.
Where It Breaks
Coverage is the ceiling. The graph knows what was recorded in a system. It does not know that a partner went to school with a founder. A graph built from two partners' inboxes will tell you, with total confidence, that the firm has no path to a company a third partner has known for years.
Recency isn't strength. The most common complaint from partners seeing their own graph for the first time is that it credits the last person to send an email, not the person with the real relationship. A weight worth trusting separates interaction type, recency, reciprocity, channel diversity, how many people at the firm know them, and seniority.
Entity resolution decides everything above it. On one build, the graph showed that a firm's most senior partner was the sender of almost none of his own email. Sender attribution matched on a person's primary address only, and his primary address in the CRM was still the one from his previous firm. The graph knew he was in those threads. What was wrong was who initiated, who replied, who owns the relationship. The fix was five lines. Nobody had found it because until you ask the graph who talks to whom, the error has no visible consequence.
Overlap isn't acquaintance. Third-party relationship data infers edges from shared employment, and it's useful, but two people at the same ten-thousand-person company for the same two years may never have met. Company names are not unique either: we've watched a network query confuse a venture firm with a defunct trading firm of nearly the same name. Match on domains and identifiers, never names, and treat inferred overlap as a lead rather than a fact.
And then the boring one. Graphs also fail in ways that have nothing to do with modeling. Connection pools exhaust under load and queries start timing out. A sync run finishes green and leaves the graph missing a node type nobody was watching. Neither shows up as an error to the user: the first reads as the tool being slow, the second as the tool being wrong. Instrument the sync itself, not just the queries on top of it.
Before You Start
Three questions, all answerable on a whiteboard, none of them about technology.
Which relationships actually exist in your data? People and companies are obvious. Is CC'd on a thread a relationship? Is sat on the same board? Is a co-investor in the same round a peer, and does that change by stage? If you can't name the edge, you can't weight it, and if you can't weight it your ranking is arbitrary.
Do you have the interaction history? Entities are easy; every CRM has people and companies. Edges need history. If it was never captured, or captured but not retained, you get a beautiful graph of nodes with almost nothing between them. Ask the same question one level up: if that history is spread across several tools and nobody has reconciled it into one record per person, evaluate the warehouse first. The graph inherits whatever you feed it, gaps included.
Which single question are you building this to answer? Firms that pick one, usually warm intro paths, and build the smallest thing that answers it end to end tend to end up with something people use. Firms that build the general-purpose relationship platform tend to end up with a demo.
The Bottom Line
Building the graph is a few weeks of work. Deciding what belongs in it, and being honest about what your data can't tell you, is the part that takes judgment.
The firms that get value from this don't have better graph databases. They have a clearer answer to what they were trying to find out.
If you are working through that answer for your own firm, we are happy to look at it with you. Tell us the one question you want the graph to settle and which systems hold your interaction history, and we will tell you what it would take to get there. Write to info@loop3studio.com.

Written by Franco Lagomarsino
Partner At Loop3